AI Algorithm Effective in Tracking, Predicting COVID-19
Nationwide surveillance algorithm may have potential in other areas of health care
By Cindy Zinkovich
June 25, 2021

Cury
Researchers combining the power of artificial intelligence (AI) with big data and chest CT reports demonstrated the value of radiology in tracking and even predicting COVID-19 outbreaks and hot spots.
In a recent Radiology: Cardiothoracic Imaging study, researchers developed a machine learning (ML) natural language processing (NLP) algorithm with the goal of extracting keywords from CT reports to generate predictions for COVID-19 and to compare those findings with official COVID-19 cases and deaths in the U.S.
“We developed this big data, technology platform for extracting meaningful value from the radiology reports,” said lead author Ricardo C. Cury, MD, chairman of radiology at Radiology Associates of South Florida and director of cardiac imaging at Baptist Health of South Florida, both in Miami. “This nationwide surveillance algorithm has the potential to help public health and other healthcare entities with planning and resource utilization and allocation.”
Dr. Cury and colleagues used de-identified radiology reports from a common imaging platform (vRad) interconnected with more than 2,100 facilities throughout all 50 states in the U.S. Researchers applied NLP algorithms to 450,114 patient chest CT scans acquired between January and October 2020, analyzing 540 chest CT studies per 1 million residents per state during the study period. The algorithms were trained to look for sets of key words typical to COVID-19 diagnoses.
Dr. Cury and colleagues then developed three NLP algorithms to track and display positive CT imaging features from respiratory illness and pulmonary findings typical of COVID-19. The three models labeled COVID-19, Imaging Findings and Viral Pneumonia, all demonstrated an early rise in cases followed by the increase of official cases, suggesting the model’s potential as an early predictive marker.
“We used data science to correlate with the official cases of COVID-19 on a daily, weekly basis and on a state basis,” Dr. Cury said. “The correlation was very strong, particularly for the more specific COVID-19 NLP model. We validated findings retrospectively and we also were able to use predictive analytics.”
The best performing model, COVID-19 NLP, showed strong correlation with daily official COVID-19 cases and demonstrated an early rise and increase in official COVID-19 rate of incidence by state.
“Early in the pandemic, using our NLP models one to two weeks before the increase in official COVID cases allowed us to detect U.S. hot spots based on imaging,” Dr. Cury said. “Over time, the curves were more aligned, probably because there was better detection with PCR testing.”
And because the algorithm offers a marker of respiratory illness and viral pneumonia, it can serve as an additional indicator to predict the need for emergency medical services, hospital staff, hospital beds, personal protective equipment and ventilator equipment, Dr. Cury said.
“Early warning and detection may represent a critical opportunity for our country to track the rate of respiratory illness and quickly institute policies to prevent or at least mitigate a future outbreak,” Dr. Cury said.
Algorithm Has Potential Beyond COVID-19
While radiologists were pivotal to the project’s success, Dr. Cury stresses that a multidisciplinary team was necessary to create the algorithm.
“A cross-functional team was an important part of this effort, including engineers, data scientists, AI experts, radiologists and researchers. It was really a great collaboration from several fields,” he said.
The researchers continue to track and forecast the impact of COVID-19 vaccination and variants. Dr. Cury also hopes the nationwide surveillance algorithm will have applications in other areas of health care.
For More Information
Access the Radiology: Cardiothoracic Imaging study, “Natural Language Processing and Machine Learning for Detection of Respiratory Illness by Chest CT Imaging and Tracking of COVID-19 Pandemic in the United States."
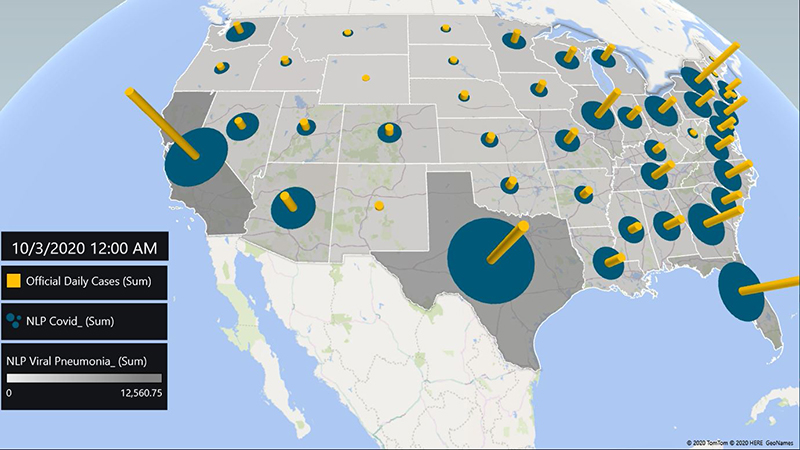
Above: The correlation between the size of the blue circles (Chest CT NLP Algorithm) and the height of the yellow vertical bars (official COVID-19 cases) in each state.
Cury et al, Radiology: Imaging Cardiothoracic Radiology 2021 © RSNA 2021
Cury et al, Radiology: Imaging Cardiothoracic Radiology 2021 © RSNA 2021