New Imaging Analysis Technique Provides Faster Treatment Assessment for Liver Cancer

A novel MRI analysis technique provides assessment of the effectiveness of liver cancer treatment far sooner than existing methods, according to preliminary results of a study presented at RSNA 2015.
Hepatocellular carcinoma (HCC) is the second leading cause of cancer-related death worldwide. Many patients undergo treatment with transarterial chemoembolization (TACE), an image-guided procedure that blocks the tumor’s blood supply while delivering chemotherapeutic drugs directly to the tumor. Identifying patients who don’t respond to TACE is critical so that they can be treated again or have their therapy changed in a timely fashion.
“In clinical oncology, it is very challenging to assess tumor response to treatment,” said study co-author Julius Chapiro, M.D., of the Yale University School of Medicine. “Up until now, we could measure the extent of tumor diameter or uptake with manual tools like the caliper on the screen, which are highly unreliable due to reader bias.”
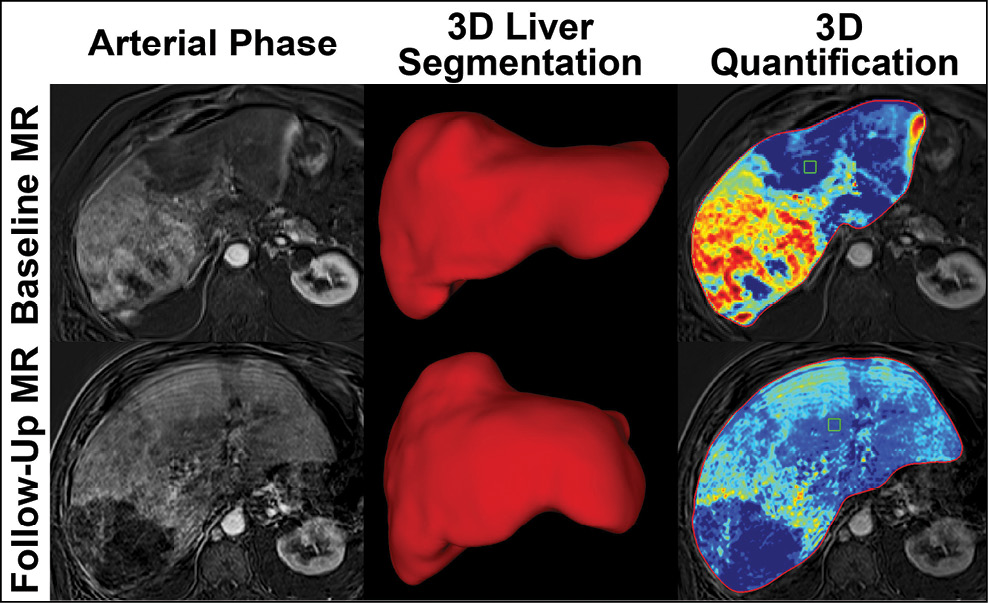
Dr. Chapiro and colleagues used the quantitative European Association for the Study of the Liver (qEASL) technique, a new 3-D approach the researchers developed in collaboration with Philips Research North America that provides whole liver volumetric enhancement quantification on MRI.
“The radiologist can segment the entire tumor with the assistance of the computer,” Dr. Chapiro said. “It’s a work-flow efficient, semi-automated process that takes 15 to 20 seconds to segment and allows you to delineate the tumor in 3-D.”
The researchers used qEASL on 68 liver cancer patients with infiltrative HCC to measure treatment response and predict survival. The ill-defined borders and the sheer number of lesions in infiltrative HCC can pose a challenge in treatment response assessment after TACE with traditional methods.
“Up until now we haven’t had any kind of objective measurement for infiltrative liver cancer,” said study co-author Susanne Smolka, one of several medical students from Charité University Medicine in Berlin who worked on the project at Yale through a grant from the R.W. Günther Foundation. “This new technique is quantitative and we can apply it to the whole liver, giving us for the first time an objective measurement.”
The patients underwent qEASL before and one month after their first TACE. The whole liver was segmented and viable tumor was identified by the degree of enhancement above surrounding healthy liver tissue. The researchers set a threshold of a 65 percent reduction in viable tumor between baseline and follow-up MRI to separate responders from non-responders.
Responders had an overall survival of approximately 21 months, compared with 6.8 months in non-responders, and a mean 57.8 percent decrease in enhancing volume, compared with a 19.1 percent increase in non-responders on average.
“The findings show that quantitative tumor enhancement is possible with 3-D qEASL and can predict survival after TACE for infiltrative and multifocal HCC,” Dr. Chapiro said.
Dr. Chapiro emphasized that qEASL is not a diagnostic tool but rather a means of comparing differences before and after treatment to identify non-responders.
“The earlier the non-responders are identified and treated, the better their outcomes,” he said.
Along with liver cancer, the approach has been validated for benign brain and uterine lesions and also could be applied to systemic therapy. It can be used with additional imaging modalities like cone-beam CT, MDCT, and SPECT, according to Jeff Geschwind, M.D., principal investigator of the project and chairman of the Department of Radiology and Biomedical Imaging at Yale.
“With this tool, we started a small revolution in how we use follow-up imaging in clinical cancer management, not only for local but for all cancer therapies,” Dr. Geschwind said. “Most importantly, we are now looking at the broad clinical application of qEASL, which has now been introduced to the community as a commercially available product.”

Web Extras
- Daily Bulletin coverage of RSNA 2015 is available at RSNA.org/Bulletin