RSNA Press Release
AI Tool Identifies Women at High Risk of Interval Breast Cancer
OAK BROOK, Ill. – In a study of more than 100,000 screening mammograms, researchers demonstrated the potential of an AI tool to help identify women at higher risk of developing interval breast cancers, breast cancer that is diagnosed between regular screening mammograms. Results of the new study were published today in Radiology, a journal of the Radiological Society of North America (RSNA).
“Interval cancers generally have a worse prognosis compared with screen-detected cancers, because they tend to be either larger or more aggressive,” said co-author Fiona J. Gilbert, M.B.Ch.B., professor of radiology, Department of Radiology at the University of Cambridge, United Kingdom (U.K.), and honorary consultant radiologist at Addenbrooke's Hospital. “That’s why it’s important to minimize the number of interval cancers that you have in any screening program.”
Using a large retrospective dataset from the U.K.’s triennial screening program, Dr. Gilbert and lead researcher Joshua W. D. Rothwell, an M.B.B.S./Ph.D. student at the University of Cambridge, employed AI to identify women for supplemental imaging to find interval cancers.
“Personalized breast cancer screening depends on accurately assessing an individual’s risk of developing breast cancer within a specific timeframe,” Dr. Gilbert said. “We can use supplemental imaging and adjust screening frequency based on a woman’s breast density and likelihood of developing breast cancer within a short timeframe.”
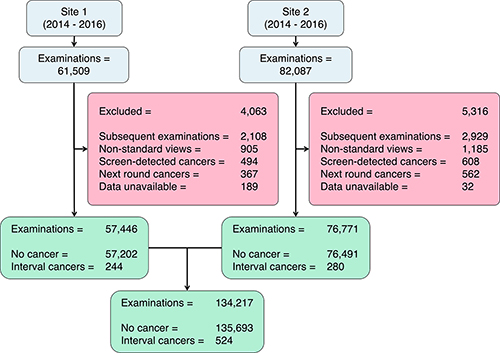
The study cohort included 134,217 screening mammograms on the same number of women (aged 50-70), with 524 interval cancers. The exams were performed between 2014 and 2016 at two U.K. triennial Breast Screening Program centers using two different mammography systems.
Negative (no cancer found) digital screening mammograms were processed by Mirai, a deep learning-based algorithm, producing a generalized risk score for developing an interval breast cancer. The AI tool primarily uses information from the mammogram, including tumor features and breast density, to make a risk prediction.
The AI tool’s 3-year risk scores retrospectively predicted 3.6% (19/524), 14.5% (76/524), 26.1% (137/524) and 42.4% (222/524) of the 524 interval cancers for women assigned the highest 1%, 5%, 10% and 20% scores. Identification of the interval cancers is equivalent to an additional cancer detection rate of 0.1, 0.6, 1.0, and 1.7 per 1,000.
“Our results suggest that further workup of mammograms within the top 20% of scores could yield 42.4% of interval cancers, meaning that Mirai could be used to identify women for supplemental imaging or a shortened screening interval, instead of or in addition to breast density,” Rothwell said.
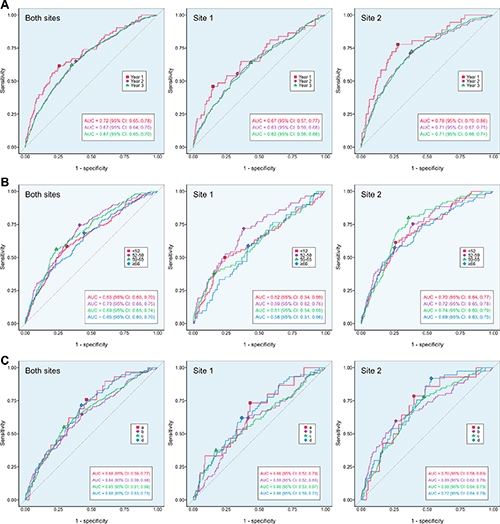
The AI tool performed better at predicting interval cancers within a year of the screening examination versus 12 to 24 months or 24 to 36 months later. While the tool was less effective in women with extremely dense breast tissue, it showed superior performance compared to conventional risk prediction tools.
In the U.K., 2.2 million women are screened for breast cancer every year. According to Dr. Gilbert, AI could help optimize the country’s triennial breast cancer screening program by improving the selection criteria for women who could benefit from supplemental imaging, such as MRI or contrast-enhanced mammography, or by shortening the screening interval.
“If we called back 20% of women for supplemental imaging, we’d have to find the capacity to offer contrast-enhanced mammography or MRI to 440,000 women,” she said.
Next steps for the researchers include comparing commercially available predictive AI tools, conducting economic modeling and a cost-effective analysis, and conducting a trial utilizing predictive AI to identify women most likely to benefit from supplemental breast imaging following screening mammography.
“Identifying women at an increased risk of developing breast cancer is a complex, multifactorial problem,” Dr. Gilbert said. “The goal is to accurately identify the women most likely to have an interval cancer while minimizing the volume of supplemental imaging performed.”“Evaluation of a Mammography-based Deep Learning Model for Breast Cancer Risk Prediction in a Triennial Screening Program.” Collaborating with Dr. Gilbert and Joshua Rothwell were Priya Rogers, M.B.B.S., M.Phil., Nicholas R. Payne, Ph.D., Yuan Huang, Ph.D., Josh D. Kaggie, Ph.D., Sarah E. Hickman. M.B.B.S., Ph.D., Fleur Kilburn-Toppin, M.B.Ch.B., Bahman Kasmai, M.Sc., and Arne Juette M.B.Ch.B.
Radiology is edited by co-interim editors Vicky Goh, M.B.B.Ch., King’s College London, U.K., and Kathryn Fowler, M.D., University of California San Diego, California, and owned and published by the Radiological Society of North America, Inc. (https://pubs.rsna.org/journal/radiology)
RSNA is an association of radiologists, radiation oncologists, medical physicists and related scientists promoting excellence in patient care and health care delivery through education, research and technologic innovation. The Society is based in Oak Brook, Illinois. (RSNA.org)
For patient-friendly information on mammography, visit RadiologyInfo.org.
Images (JPG, TIF):
Figure 1. Flow diagram of included and excluded patients. Examinations with “nonstandard mammographic views” were those that did not comprise exactly one of each standard mammographic view (one mediolateral oblique and one craniocaudal per breast).


