
RSNA Press Release
Where You Live May Influence Your Brain Health

OAK BROOK, Ill. – In a study analyzing nearly 3,000 brain MRI exams, researchers found that living in highly disadvantaged neighborhoods was associated with adverse brain health. Results of the study were published today in Radiology, a journal of the Radiological Society of North America (RSNA).
“We’ve long suspected that your living environment affects your brain, but until now it’s not been proven at scale in clinical populations,” said John-Paul J. Yu, M.D., Ph.D., associate professor of radiology, psychiatry, biomedical engineering and biostatistics and medical informatics at the University of Wisconsin School of Medicine and Public Health in Madison, Wisconsin, and an associate director at the Center for Health Disparities Research at the University of Wisconsin–Madison. “We’ve shown very robust, measurable metrics that our living environment has an outsized impact on the brain at the molecular and cellular level.”
For the retrospective study, researchers investigated whether living in the most socioeconomically disadvantaged neighborhoods was associated with two key brain health metrics: higher brain age gap and decreased total brain volume. Brain age gap is the difference between a person’s actual age and how much younger or older the brain appears based on estimates from MRI exams.
The researchers analyzed brain MRIs from 2,826 patients (1,094 men and 1,732 women), ranging in age from 18 to 96 years. The neuroimaging data was acquired from consecutive inpatient and outpatient clinical MRI examinations at the University of Wisconsin Hospitals and Clinics and community partners from January 2024 to June 2024.
Patients with imaging evidence of disease were excluded from the study. Volumetric measures were normalized to intracranial volume, and models were controlled for age and sex.
For each patient, researchers calculated an Area Deprivation Index (ADI) score, a measure of neighborhood-level socioeconomic disadvantage based on the resident’s zip code. ADI is a census block group–level composite measure incorporating 17 indicators of income, education, employment and housing characteristics derived from 2023 American Community Survey data.
The researchers found that individuals living in the most disadvantaged neighborhoods exhibited a higher brain age gap and lower total brain volume.
“We found that residents in the most disadvantaged neighborhoods had an accelerated brain age compared with people living in less deprived areas,” Dr. Yu said. “In other words, where you live leaves a measurable imprint on your brain.”
Elevated brain age has been associated with cardiovascular risk factors, psychiatric illness and cognitive impairment.
Analysis of the MRI data also found that residents of the most disadvantaged neighborhoods had higher white matter hyperintensity volume.
“White matter hyperintensities are essentially the footprints of cardiovascular damage in the brain,” Dr. Yu said. “When you live with chronic stressors like high blood pressure, poor sleep or constant stress, blood vessels constrict, restricting blood flow to that part of the brain. Over time, these areas show up as these bright spots on MRI.”
Larger white matter hyperintensity volumes are connected to a higher risk of memory loss, cognitive problems and dementia.
Dr. Yu said the study’s findings suggest that data derived from MRI may serve as intermediate imaging biomarkers of structural inequity, with relevance for both population neuroscience and clinical risk stratification.
“We have shown for the first time in a real-world clinical population that an individual’s environment has clear, quantifiable implications for brain age, and, by proxy, brain health,” he said. “The conditions in which individuals are born, live, work and age, profoundly shape long-term neurological health outcomes.”
Dr. Yu said the relationship between neighborhood-level socioeconomic disadvantages and brain health is an emerging area of research with critical implications for basic research, public health and clinical practice.
“Neighborhood disadvantage, quantified by indices such as the ADI, is an important determinant because it reflects accumulated structural inequities extending beyond individual behaviors that contribute to disparities in clinical outcomes,” he said. “It’s important to factor in this data when planning health intervention programs, crafting public policy, and identifying geographically defined areas that need improved access to care.”“Evaluating the Effect of Neighborhood-level Disadvantage on Brain Health: An Imaging Epidemiology Study.” Collaborating with Dr. Yu were Ethan H. Willbrand, B.A., Elizabeth M. Stoeckl, M.D., Daryn Belden, B.S., Sheena Y. Chu, Ph.D., Eleanna M. Melcher, B.A., Daniil Zhitnitskii, B.S., Elena Bonke, Ph.D., Jussi Mattila, Ph.D., Usman Iftikhar, B.S., Juha Koikkalainen, D.Sc., Antti Tolonen, M.S., Jyrki Lötjönen, D.Sc., and Richard Bruce, M.D.
Radiology is edited by Suhny Abbara, M.D., FACR, MSCCT, Mayo Clinic, Jacksonville, Florida, and owned and published by the Radiological Society of North America, Inc. (https://pubs.rsna.org/journal/radiology)
RSNA is an association of radiologists, radiation oncologists, medical physicists and related scientists promoting excellence in patient care and healthcare delivery through education, research and technologic innovation. The Society is based in Oak Brook, Illinois. (RSNA.org)
For patient-friendly information on brain MRI, visit RadiologyInfo.org.
Images (JPG, TIF):
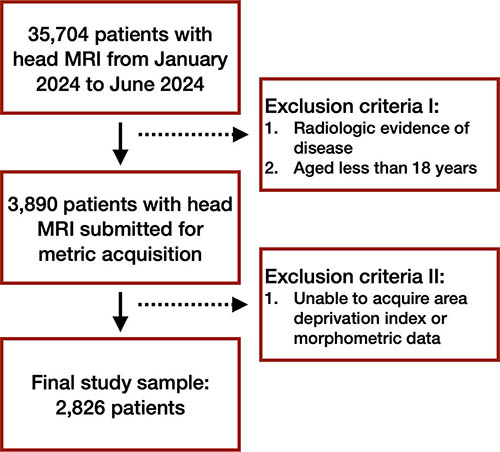
Figure 1. Flowchart outlines patient selection. Leftward boxes connected by solid arrows indicate the number of patients at each exclusion checkpoint. Rightward boxes stemming from dashed arrows highlight the exclusion criteria.
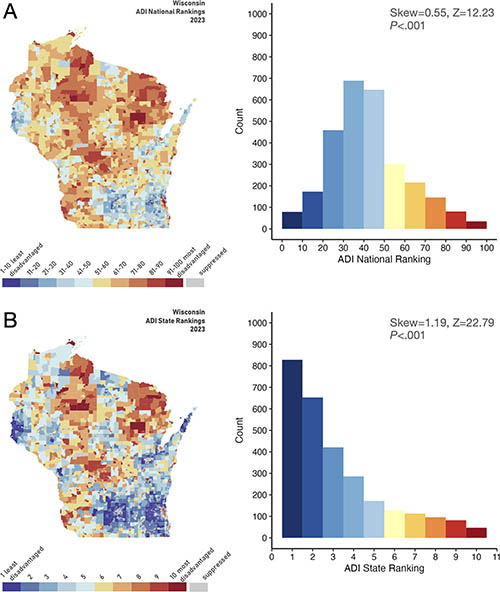
Figure 2. National and state neighborhood-level disadvantage rankings of the study patients. (A) National disadvantage rankings are shown. Left: area deprivation scores mapped onto the state of Wisconsin, where the study sample resides, with national ranking deciles shown. Blue indicates less disadvantaged neighborhoods, whereas red indicates more disadvantaged neighborhoods. Right: histogram quantifying the number of patients in each Area Deprivation Index (ADI) decile. (B) Same as A, but state ranking deciles are shown. The distributions of both the national- and state-level ADI rankings of the patients were skewed toward less disadvantaged neighborhoods.
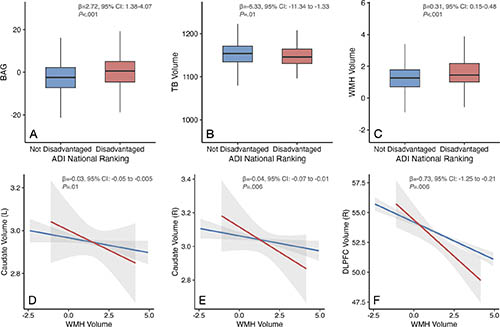
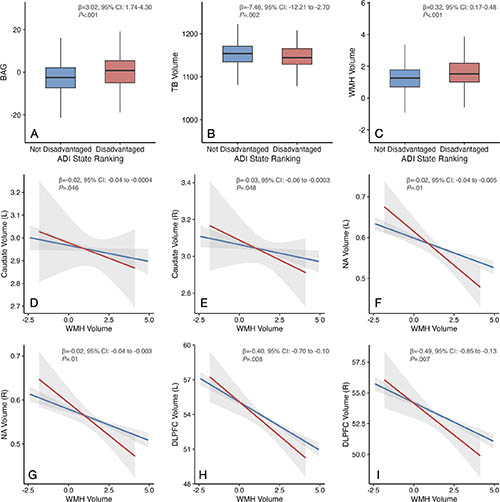
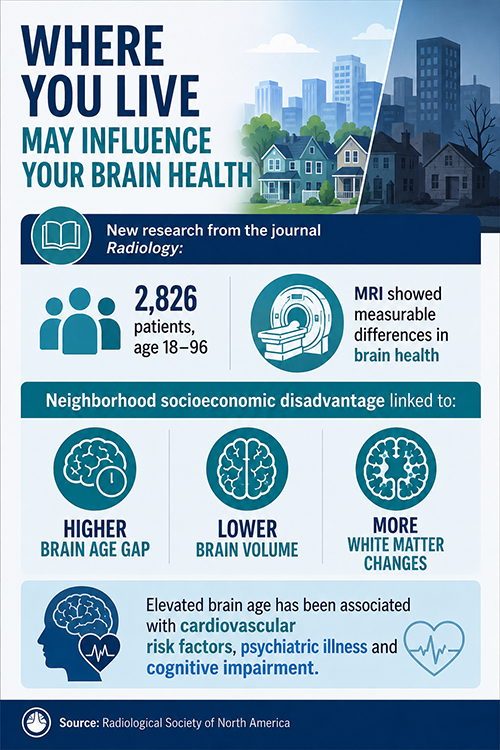
Infographic. Infographic generated with AI assistance.